Which States Are Givers and Which Are Takers?
And is that even the correct way to frame the question?
Updated on March 8, 2017.
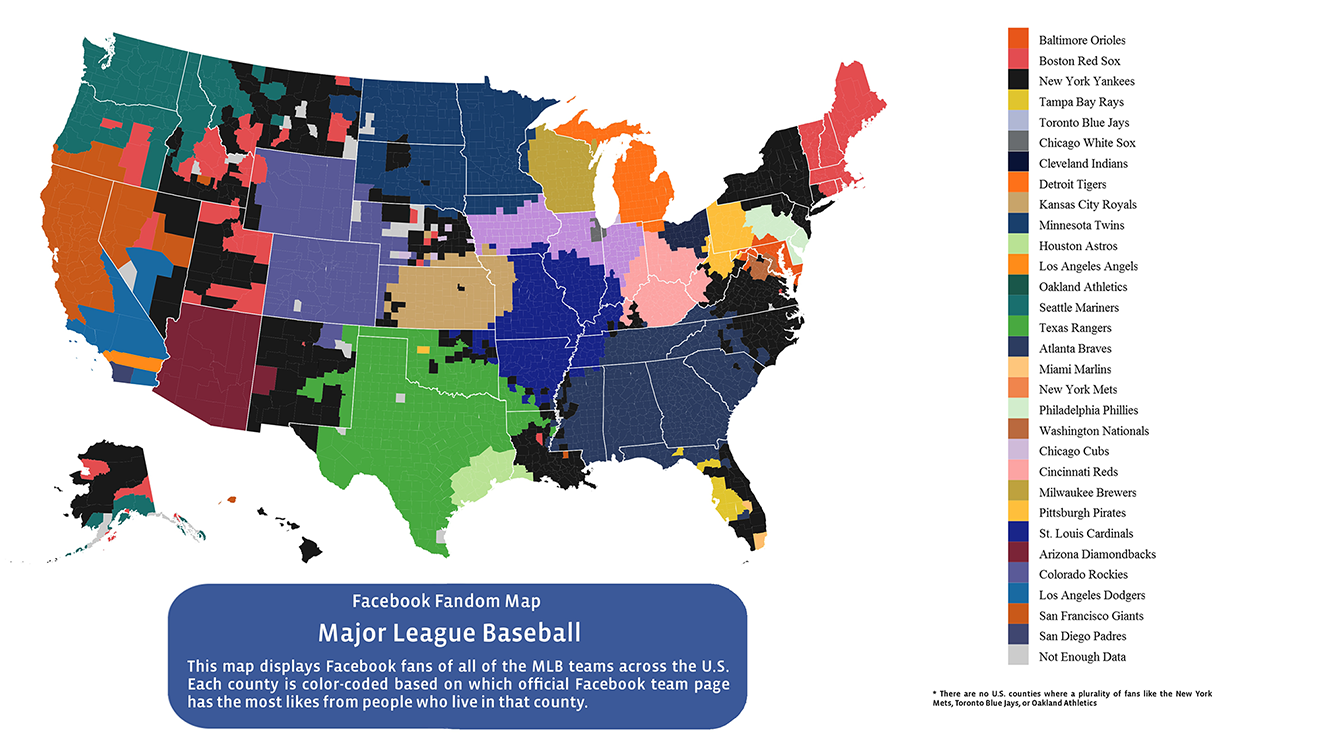
Maps showing regional differences among Americans are all the rage these days, such as this depiction of the contours of baseball fandom, or this one of the beers we're alleged to favor, or this showing the places in America where none of us lives, or this creative video/map showing where Americans use different words for common things such as soda.
For my money, one of the more interesting maps appearing recently came from the personal-finance website WalletHub. Analysts there set out to determine how states compare in terms of their reliance on federal funding.
The WalletHub analysts essentially asked how much each state receives back as a return on its federal income-tax investment. They compared the 50 states and the District of Columbia on three metrics: (1) federal spending per capita compared with every dollar paid in federal income taxes; (2) the percentage of a state’s annual revenue that comes from federal funding; and (3) the number of federal employees per capita. The third measure received only half the weight of each of the others in the calculation.
What the resulting map shows is that the most “dependent states,” as measured by the composite score, are Mississippi and New Mexico, each of which gets back about $3 in federal spending for every dollar they send to the federal treasury in taxes. Alabama and Louisiana are close behind.
If you look only at the first measure—how much the federal government spends per person in each state compared with the amount its citizens pay in federal income taxes—other states stand out, particularly South Carolina: The Palmetto State receives $7.87 back from Washington for every $1 its citizens pay in federal tax. This bar chart, made from WalletHub’s data, reveals the sharp discrepancies among states on that measure.
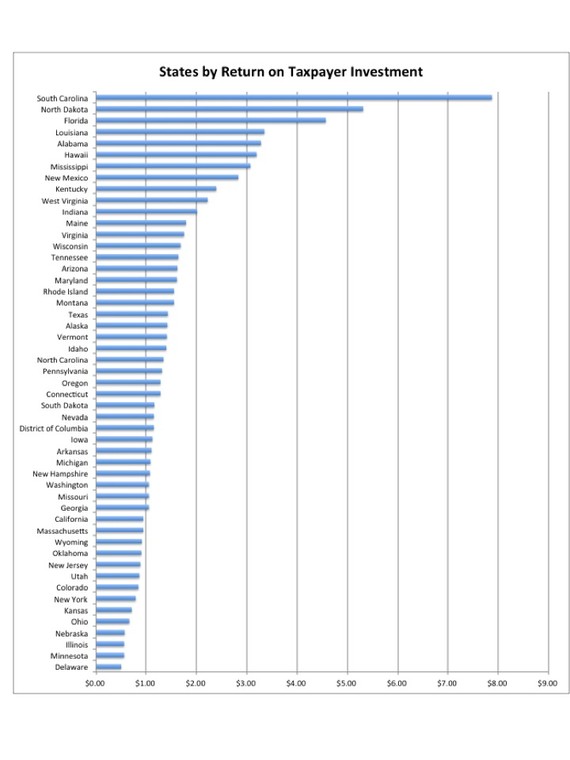
On the other side of this group, folks in 14 states, including Delaware, Minnesota, Illinois, Nebraska, and Ohio, get back less than $1 for each $1 they spend in taxes.
It’s not just that some states are getting way more in return for their federal tax dollars, but the disproportionate amount of federal aid that some states receive allows them to keep their own taxes artificially low. That’s the argument WalletHub analysts make in their 2014 report on best and worst states to be a taxpayer.
Part of the explanation for why southern states dominate the “most dependent” category is historical. During the many decades in the 20th century when the South was solidly Democratic, its congressional representatives in both the House and the Senate, enjoying great seniority, came to hold leadership positions on powerful committees, which they used to send federal dollars back to their home states in the form of contracts, projects, and installations.
Another part of the explanation is easier to discern. The reddest states on that map at the top—Mississippi, Alabama, Louisiana, New Mexico, Maine—have exceptionally high poverty rates and thus receive disproportionately large shares of federal dollars. Through a variety of social programs, the federal government disburses hundreds of billions of dollars each year to maintain a “safety net” intended to help the neediest among us. Consider, for example, the percentage of each state’s residents who get food stamps through the federal government’s SNAP program. This chart tells the story.
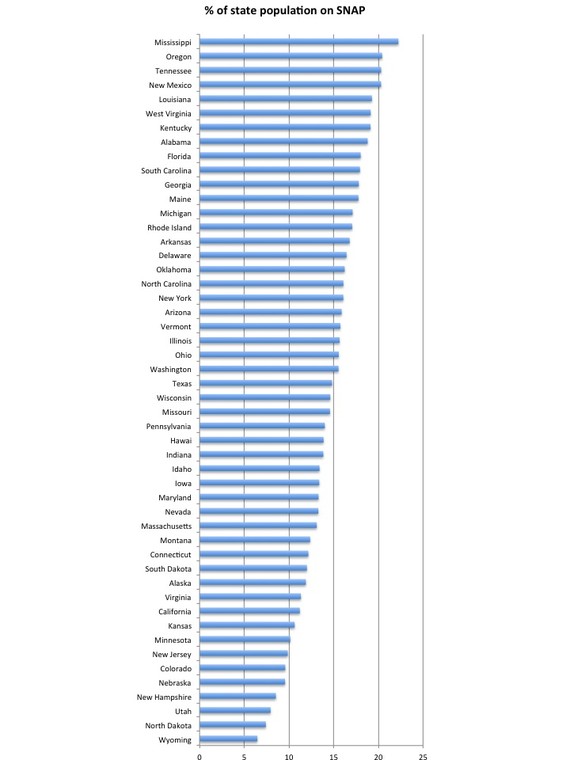
Another way of getting at the same point is to map the percentage of families in 2012 with incomes below the federal poverty level (according to the Census Bureau’s ACS five-year estimate). This map, made through Social Explorer, shows the data at the county level: The darker the shading, the higher the percentage of impoverished residents.
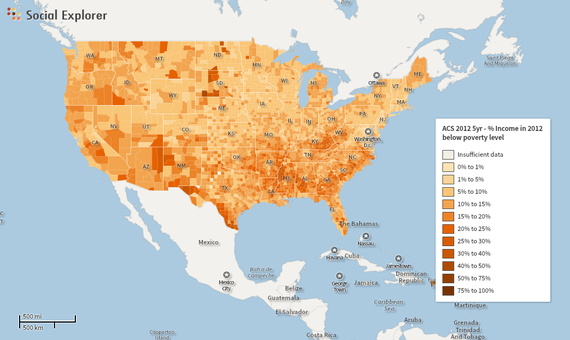
You can go here to see an interactive version of this map that enables you to scroll your cursor over counties and get pop-up information showing the percentages for any specific county. You can also change the map view, showing the data at different levels, ranging from states all the way down to individual census block groups. (To see the mapped data at sub-county levels, you have to zoom way in to particular areas.)
There are various ways of thinking about what WalletHub’s “state dependency” map tells us. One approach is to shine light on the red-states-as-takers paradox: Dominated by Republican voters who profess their distaste for the federal government and its social programs, these are the very states that rank highest on the dependency index. That, for example, is how Business Insider handled the story:
Who really benefits from government spending? If you listen to Rush Limbaugh, you might think it was those blue states, packed with damn hippie socialist liberals, sipping their lattes and providing free abortions for bored, horny teenagers. ...
As it turns out, it is red states that are overwhelmingly the Welfare Queen States. Yes, that's right. Red States—the ones governed by folks who think government is too big and spending needs to be cut—are a net drain on the economy, taking in more federal spending than they pay out in federal taxes. They talk a good game, but stick Blue States with the bill.
Fair enough. That’s a catchy perspective. And there are few things more fun than exposing hypocrisy.
Alternatively, we could use the “state dependency” map as an opportunity to reflect on a different paradox—the long-standing role of the far-away federal government as an agent of community. Because of federal programs, people in places like South Carolina and Mississippi are getting a helping hand not from their neighbors a few blocks away or in the next county over, but from residents of Delaware, Minnesota, Illinois, and Nebraska. Whether you like that idea depends, in part, on how you personally reconcile the tension between two long-cherished, core American values—our passion for individualism and our regard for community—and whether you see “community” as encompassing the whole country.
That's a far more interesting thing to think about (though perhaps less viscerally satisfying) than which states are moochers or freeloaders and which are getting fleeced.