
Nick Clegg and Michael Gove this morning announced details of the English Baccalaureate, the qualification that will replace GCSEs as the exam sat by 16-year-olds in England.
The first English Baccalaureate - or EBacc - courses will start in September 2015 and will remove the opportunity to retake modules, cut down on coursework and reintroduce the tough end-of-year exams that were phased out during the GCSE era.
In their story here, Hélène Mulholland and Nicholas Watt write:
The changes will lead to an overhaul of the module system as course work is replaced by exams. Fewer students will achieve the higher grades as the government seeks to raise academic standards. It is expected that around 10% of pupils will be awarded a grade 1. Under the current system around a third of pupils are awarded A or A* grades. There will also be only one exam board. Ministers believe exam boards have in recent years competed for business by making it easier for pupils to obtain higher grades
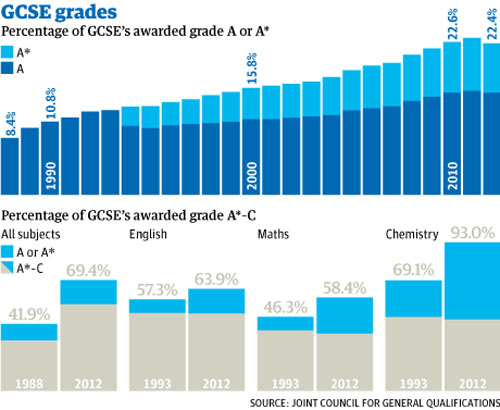
Since their introduction GCSEs have been criticised over perceived grade inflation. The proportion of entries awarded grades A* to C rose every year from 1988 to 2011, falling for the first time - from 69.8% to 69.4% - in 2012.
The percentage achieving grade A* or A also climbed every year until 2012. 2.8% of GCSE entries were awarded the A* grade when it was introduced in 1993, but 7.8% - or almost one in twelve - were given the top grade in 2011.
Of all core subjects, the sciences have seen some of the largest improvements in grade attainment. The pass rate, or proportion of entries awarded a C or above, for Biology rose from 60.5% to 93.1% between 1993 and 2011.
The pass rate for science double award - where pupils studied aspects of Biology, Chemistry and Physics and received two GCSEs - almost doubled between 1993 (46.1%) and 2010 (87.2%) when it was discontinued.
The cause of such improvements in achievement has always been debated, and research published earlier this year by Ofqual found that exams had become easier in the last ten years.
The number of GCSE entries has fluctuated since 1988, but shows little sign of a clear trend. The total across all subjects declined steadily from 2007 to 2011, but picked up in 2012, rising by 73,000.
Follow the link below to explore and download full historical subject-by-subject grade attainment rates.
Data summary
Download the data
• DATA: download the full spreadsheet
NEW! Buy our book
• Facts are Sacred: the power of data (on Kindle)
More open data
Data journalism and data visualisations from the Guardian
World government data
• Search the world's government data with our gateway
Development and aid data
• Search the world's global development data with our gateway
Can you do something with this data?
• Flickr Please post your visualisations and mash-ups on our Flickr group
• Contact us at data@guardian.co.uk
• Get the A-Z of data
• More at the Datastore directory
• Follow us on Twitter
• Like us on Facebook
