Markets
By This Measure, the U.S. has the 2nd Highest National Debt
By This Measure, the U.S. has the 2nd Highest National Debt
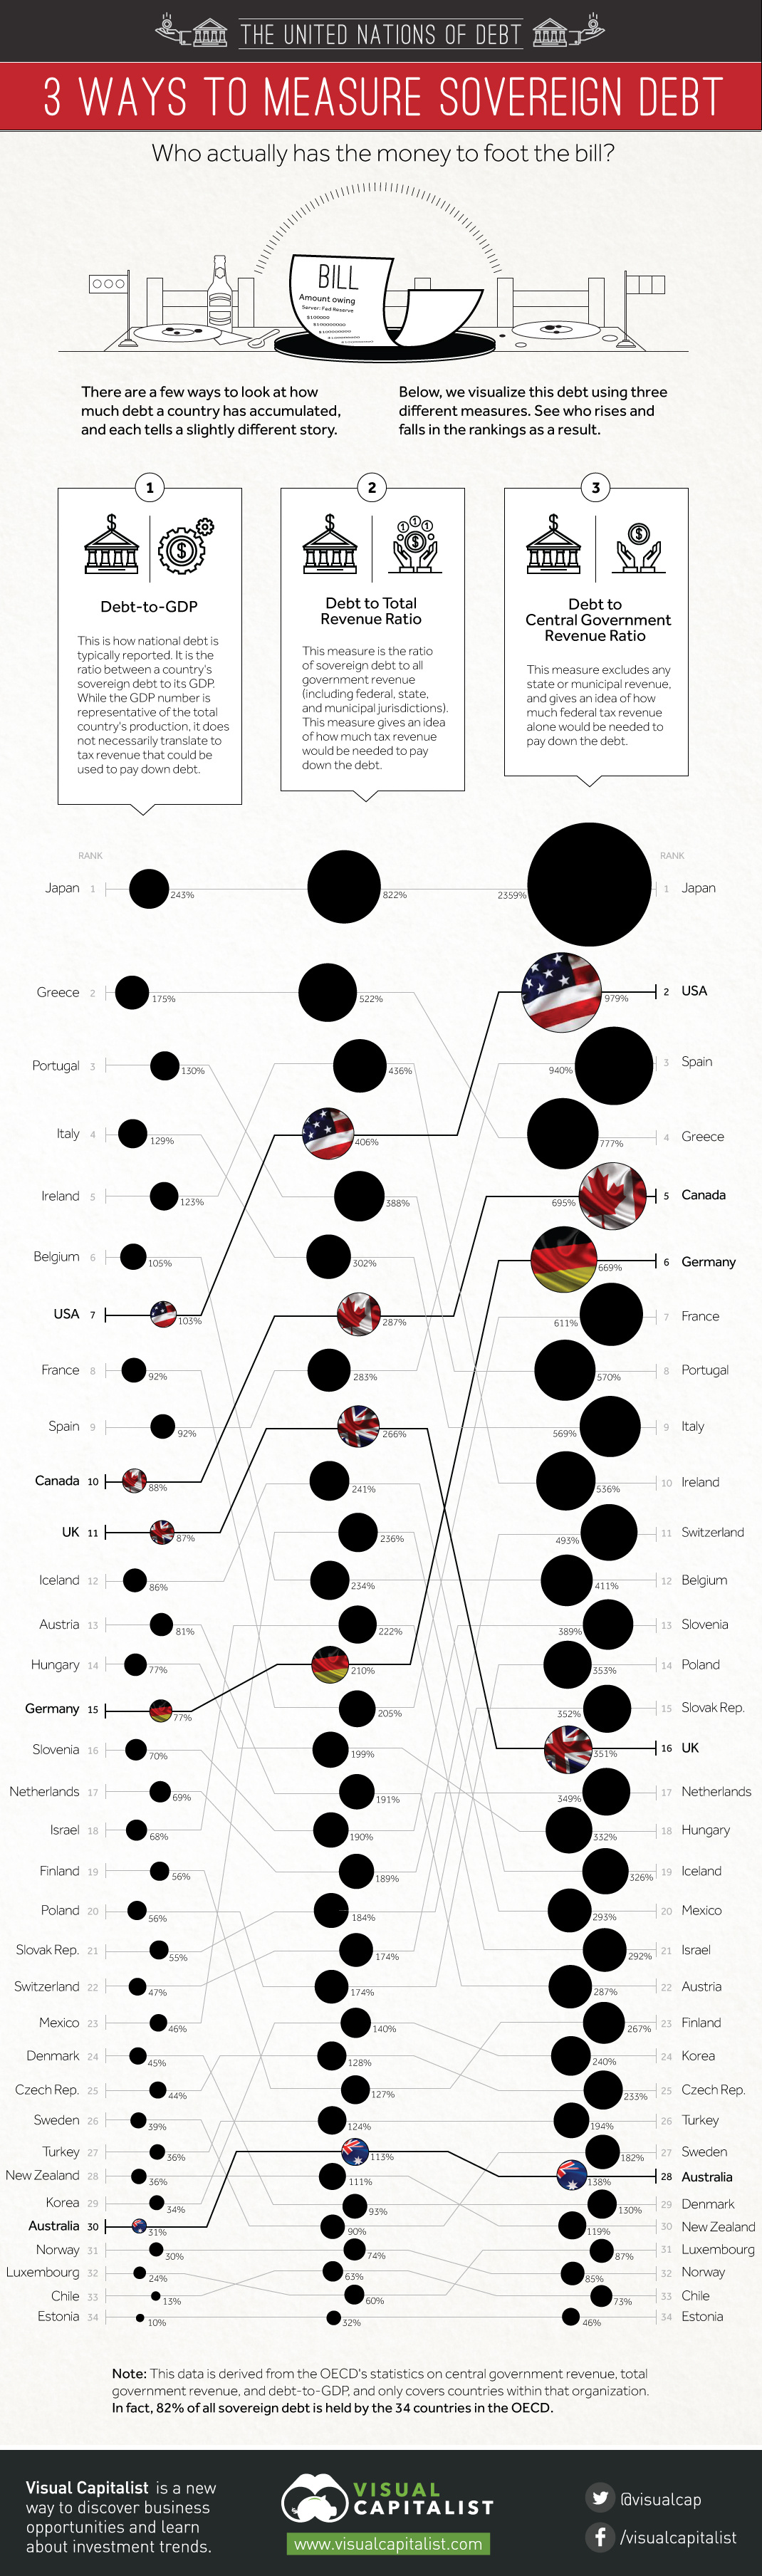
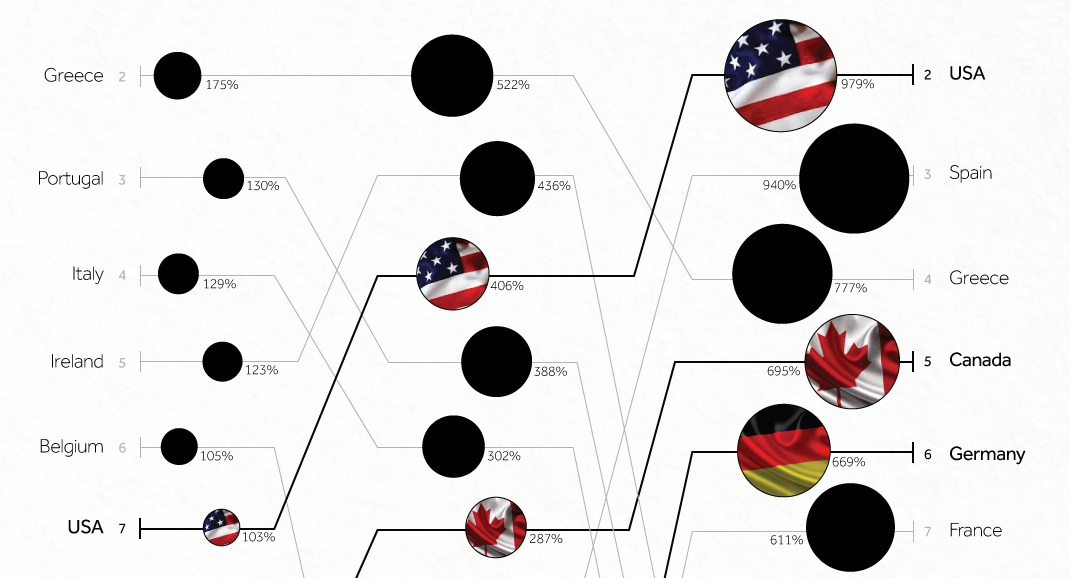
USA is #7 in debt to gdp, but #2 in debt to revenue
In absolute terms, the United States is the most indebted country in the world, accounting for 29% of the world’s $60 trillion of sovereign debt.
However, this is not really a fair comparison in some ways because it does not account for the relative wealth of the country in contrast to poorer economies. That’s why it is standard practice to measure sovereign debt in a ratio comparing it directly to the economic productivity, measured by gross domestic product (GDP).
Using this ratio in comparison with other OECD countries, the United States is a modest 7th place (out of 34) in the rankings in terms of its debt load. However, as Jeffrey Dorfman writes in Forbes, comparing debt and GDP has some considerable problems.
The major issue is that economic production cannot be converted directly to dollars that a government can spend. If this were true, a government could claim everyone’s income as taxes and use it to pay down the debt. However, in reality, a 100% tax rate would make everyone would quit their jobs or leave the country. That’s why it makes more sense to compare a government’s debt to the actual tax revenue collected, as this creates a clearer picture of the country’s debt burden and the capacity to pay.
We pulled the latest data from the OECD to compare three ways of measuring the amount of debt that a country has accumulated. The first is the standard Debt to GDP ratio. In addition, we looked at Debt to Revenue (this includes all federal, state, and municipal tax revenues) as well as Debt to Central Government Revenue (this excludes state and municipal tax revenue). The data from the OECD database is from 2013.
When tabulated using all three measures, the world debt picture changes significantly. The United States is 7th in Debt to GDP with a ratio of 103%, but it jumps to 4th place (406%) in terms of Debt to Revenue, and then 2nd place (979%) in terms of Debt to Central Government Revenue. In other words, when it comes to the actual capacity to pay down this debt, the United States is the second most indebted country in the world. Even if the federal government theoretically used all tax revenue to pay down debt, it would take 10 years (not including any interest).
Of course, the United States also has the world’s reserve currency for now, which gives it more flexibility with its debt and monetary policy. This is less true for a country like Greece, where the currency cannot be devalued at all so long as the country is a part of the EU.
How do other major countries do when comparing the regular measure to the new one using revenue? Canada jumps five spots to 5th place with 695%, and Germany jumps nine spots to 6th place. The UK drops five spots down to 16th overall with 351%. Australia rises two spots from 30th to 28th.


Markets
U.S. Debt Interest Payments Reach $1 Trillion
U.S. debt interest payments have surged past the $1 trillion dollar mark, amid high interest rates and an ever-expanding debt burden.


U.S. Debt Interest Payments Reach $1 Trillion
This was originally posted on our Voronoi app. Download the app for free on iOS or Android and discover incredible data-driven charts from a variety of trusted sources.
The cost of paying for America’s national debt crossed the $1 trillion dollar mark in 2023, driven by high interest rates and a record $34 trillion mountain of debt.
Over the last decade, U.S. debt interest payments have more than doubled amid vast government spending during the pandemic crisis. As debt payments continue to soar, the Congressional Budget Office (CBO) reported that debt servicing costs surpassed defense spending for the first time ever this year.
This graphic shows the sharp rise in U.S. debt payments, based on data from the Federal Reserve.
A $1 Trillion Interest Bill, and Growing
Below, we show how U.S. debt interest payments have risen at a faster pace than at another time in modern history:
| Date | Interest Payments | U.S. National Debt |
|---|---|---|
| 2023 | $1.0T | $34.0T |
| 2022 | $830B | $31.4T |
| 2021 | $612B | $29.6T |
| 2020 | $518B | $27.7T |
| 2019 | $564B | $23.2T |
| 2018 | $571B | $22.0T |
| 2017 | $493B | $20.5T |
| 2016 | $460B | $20.0T |
| 2015 | $435B | $18.9T |
| 2014 | $442B | $18.1T |
| 2013 | $425B | $17.2T |
| 2012 | $417B | $16.4T |
| 2011 | $433B | $15.2T |
| 2010 | $400B | $14.0T |
| 2009 | $354B | $12.3T |
| 2008 | $380B | $10.7T |
| 2007 | $414B | $9.2T |
| 2006 | $387B | $8.7T |
| 2005 | $355B | $8.2T |
| 2004 | $318B | $7.6T |
| 2003 | $294B | $7.0T |
| 2002 | $298B | $6.4T |
| 2001 | $318B | $5.9T |
| 2000 | $353B | $5.7T |
| 1999 | $353B | $5.8T |
| 1998 | $360B | $5.6T |
| 1997 | $368B | $5.5T |
| 1996 | $362B | $5.3T |
| 1995 | $357B | $5.0T |
| 1994 | $334B | $4.8T |
| 1993 | $311B | $4.5T |
| 1992 | $306B | $4.2T |
| 1991 | $308B | $3.8T |
| 1990 | $298B | $3.4T |
| 1989 | $275B | $3.0T |
| 1988 | $254B | $2.7T |
| 1987 | $240B | $2.4T |
| 1986 | $225B | $2.2T |
| 1985 | $219B | $1.9T |
| 1984 | $205B | $1.7T |
| 1983 | $176B | $1.4T |
| 1982 | $157B | $1.2T |
| 1981 | $142B | $1.0T |
| 1980 | $113B | $930.2B |
| 1979 | $96B | $845.1B |
| 1978 | $84B | $789.2B |
| 1977 | $69B | $718.9B |
| 1976 | $61B | $653.5B |
| 1975 | $55B | $576.6B |
| 1974 | $50B | $492.7B |
| 1973 | $45B | $469.1B |
| 1972 | $39B | $448.5B |
| 1971 | $36B | $424.1B |
| 1970 | $35B | $389.2B |
| 1969 | $30B | $368.2B |
| 1968 | $25B | $358.0B |
| 1967 | $23B | $344.7B |
| 1966 | $21B | $329.3B |
Interest payments represent seasonally adjusted annual rate at the end of Q4.
At current rates, the U.S. national debt is growing by a remarkable $1 trillion about every 100 days, equal to roughly $3.6 trillion per year.
As the national debt has ballooned, debt payments even exceeded Medicaid outlays in 2023—one of the government’s largest expenditures. On average, the U.S. spent more than $2 billion per day on interest costs last year. Going further, the U.S. government is projected to spend a historic $12.4 trillion on interest payments over the next decade, averaging about $37,100 per American.
Exacerbating matters is that the U.S. is running a steep deficit, which stood at $1.1 trillion for the first six months of fiscal 2024. This has accelerated due to the 43% increase in debt servicing costs along with a $31 billion dollar increase in defense spending from a year earlier. Additionally, a $30 billion increase in funding for the Federal Deposit Insurance Corporation in light of the regional banking crisis last year was a major contributor to the deficit increase.
Overall, the CBO forecasts that roughly 75% of the federal deficit’s increase will be due to interest costs by 2034.

-

 Real Estate2 weeks ago
Visualizing America’s Shortage of Affordable Homes
-

 Technology1 week ago
Ranked: Semiconductor Companies by Industry Revenue Share
-

 Money1 week ago
Which States Have the Highest Minimum Wage in America?
-

 Real Estate1 week ago
Ranked: The Most Valuable Housing Markets in America
-

 Business2 weeks ago
Charted: Big Four Market Share by S&P 500 Audits
-

 AI2 weeks ago
The Stock Performance of U.S. Chipmakers So Far in 2024
-

 Misc2 weeks ago
Almost Every EV Stock is Down After Q1 2024
-

 Money2 weeks ago
Where Does One U.S. Tax Dollar Go?